Next: Summary of Differences and Up: Input Data Analysis: Broadcast Previous: Average Speaker Turn Duration Contents
Given the analysis performed in the previous subsection, it was found interesting to look at the overlap regions in more detail. These are found with less frequency in the broadcast news data and it only started being evaluated with the start of the meetings domain evaluations. Nowadays overlap is considered an important feature of the meeting data and therefore is included in the main metric in the NIST RT evaluations. An analysis of the overlap was performed for both forced-alignments and hand-alignments in the conference room data, and it is shown in table 3.13. In it, the average, maximum and standard deviation segment length is computed for the overlap regions alone and for the regions without any overlap.
From the average duration of the overlap regions one can see how much difference in average length there is between both transcription sources. The hand alignments are double the length than the forced-alignments in average, probably due to the difference in how the transcriptions are created. A human transcriber upon listening to an overlap region might have labelled it grossly, allowing for a few extra milliseconds in either side. The forced-alignments are based on the uttered words, which are tightly aligned by the ASR system. One drawback of the forced-alignments on overlap regions comes when the transcribers that wrote down the words miss the words or sounds existing in the overlaps, and therefore the transcription is not aligned correctly. Finally, on the overlap results, note that the values on the hand-alignments have a much bigger standard deviation than the automatically generate ones.
Regarding the analysis of values in the regions without any overlap, the same observation as in the previous subsection can be made. The average length of the speaker turns is bigger in the hand-alignments, probably due to the consistent miss of small silence regions, shown also by the values of the maximum segment lengths.
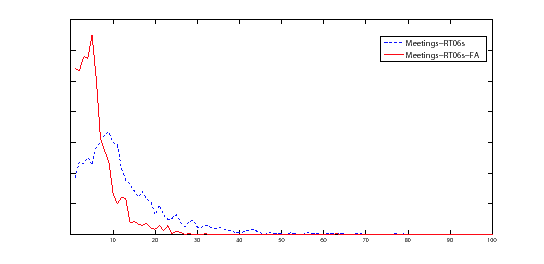
To further analyze the duration of the overlaps, in figure 3.4 the histograms of the lengths of the overlap segments in both forced-alignments and hand-alignments is shown. As hinted by the averages, the peak of the forced-alignment overlaps falls around 0.5 seconds, while the peak of the hand-alignments is around 1 second and has a broader range of bigger values than the forced-alignments.
user 2008-12-08