Next: Pros and Cons of Up: Participation in the 2006 Previous: Participation in the 2006 Contents
In this section the NIST official scores are shown for all of the ICSI systems presented in the RT06s evaluation in the speaker diarization (SPKR) task and the speech activity detection (SAD) task. In RT06s the main metric used was DER including the speaker overlap regions. In tables 7.2 and 7.3, the SPKR results are shown both for conference and lecture room data, and in table 7.4 the SAD results are shown. During the development of the systems for RT06s focus was switched at using forced-alignments as reference segmentations instead of hand-alignments, which were believed to be less reliable. In all cases in the results tables they show both the official hand-made references and the forced-alignment references.
In general, results for RT06s using hand-alignments were much worse than in previous years for conference room, which was not so pronounced when evaluating results using the forced alignments. This might be due to the increased complexity of the data and of a decrease in the quality of the hand-generated transcriptions for RT06s evaluation.
|
In the SPKR task for conference room a substantial improvement can be seen between the first three systems in MDM and the last two due to using delays as features in diarization. In lecture room data (Table 7.3, third column) the use of delays affects negatively the performance, possibly due to the existence of people moving around the room (delays consider a different speaker for each location).
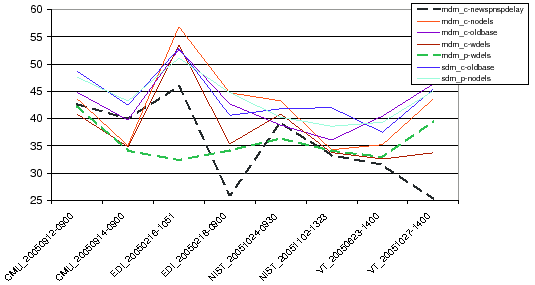
Figure 7.3 shows the DER per meeting for each of the presented systems. It is interesting to observe that the primary MDM system (mdm_p-wdels) obtains flatter scores for all the shows than using last year's system, labelled as mdm_c-newspnspdelay. Both are shown in dashed lines in figure 7.3.
In general the more microphones available for processing, the better the results. As the diarization system is the same, the improvement is thanks to the filter&sum processing. This is clear in the conference room data, while in the lecture room data results are mixed. It is believes that this is due to the big difference in quality between the microphone used in SDM and all others.
In the lecture room results shown in Table 7.3 a comparison is made between the manual and forced-alignment DER for all systems submitted. The third column shows the results using the latest release of the manual reference segmentations (18 meeting segments). When generating the forced-alignments using the IHM channels from each individual speaker we could not produce them for the meeting segments containing speakers not wearing any headset microphone. The last column shows results using forced-alignment references for a subset of 17 meeting segments containing all speakers who wore a headset microphone. The second to last column shows results using this same subset and using hand-alignments for comparison purposes.
Results using FA references are much better than using hand-alignments in the conference room, while they remain similar in lecture room (with a constant improvement of 0.5% to 1% for FA). It is believed that the conference room manual references contain many human-created problems, which were filtered out in the lecture room references after several redistributions of references.
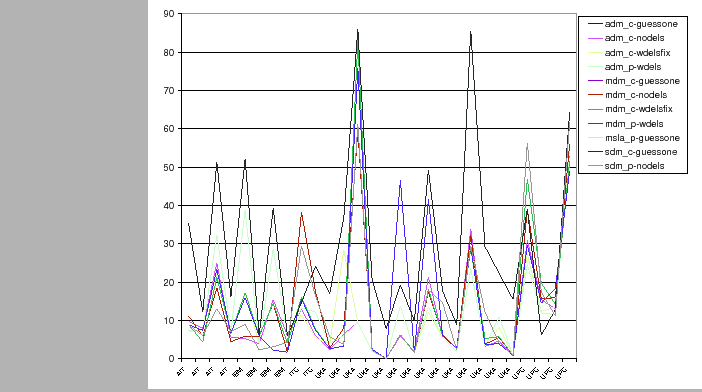
Figure 7.4 shows the break-down of the DER for all presented systems for the lecture room data. Some meetings are much harder to process than others, creating spikes in the DER curves, more or less pronounced depending on the system. In some cases the ADM systems perform as well in these ``hard'' meetings as in the easier ones.
On the other hand, in table 7.4 results are shown for systems on conference and lecture room data for the SAD task, using the new speech/non-speech detector developed for RT06s evaluation.
|
The RT06s speech/non-speech detector was developed using forced-alignment (FA) data. Therefore the results of the SAD are better as shown in the forced-alignment column. The increase in % MISS in the hand-aligned conference data compared to the FA results is probably due to silence regions (greater than 0.3s) that are correctly labelled by the FA transcriptions but are considered speech by the hand-alignments.
As was done for the diarization experiments, a subset of meetings was created to appropriately evaluate the lecture room systems using forced-alignment references, and the counterpart hand-alignments for completeness. One initial observation is that the error rate decreases dramatically when evaluating only a subset of the shows using hand-alignments. Possible explanations for this are transcription errors produced due to the lower quality of the non-headset microphones used in the eliminated set of meetings, and/or an overall decrease of quality on these meetings for causes other than the transcription process.
As in the diarization results, these experiments also obtain better results the more microphones used, thanks to the filter&sum module. When comparing the forced-alignment with the hand-alignment subset the first group keeps a better balance between misses and false alarms, indicating that parameters defined in development translate robustly to the evaluation data.
Overall, for RT06s there was a big improvement with the use of delays between microphones as a feature in the diarization process for conference room data, while mixed results were obtained in lecture room. Also, a general improvement was observed using filter&sum on as many microphone signals as possible.
user 2008-12-08