Next: Participation in the 2006 Up: Participation in the 2005 Previous: Lecture Room Systems Contents
The main metric used for the RT05s evaluation was the Diarization Error Rate (DER) not taking into account the speaker overlap regions. The DER scores as they were released by NIST are shown in the ninth column of table 7.1, together with a summary of each system's characteristics. The numbers in the tenth column reflect improvements after small bug fixes right after the evaluation, mainly coming from problems in two of the meetings.
|
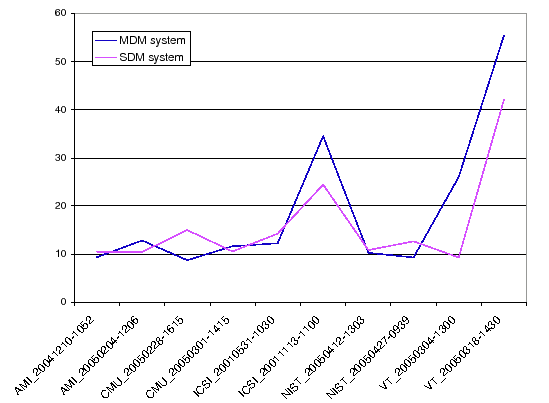
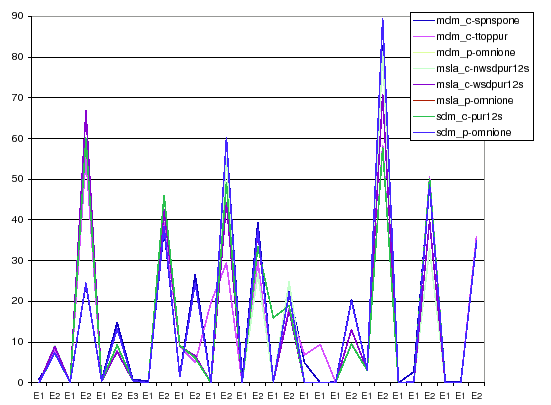
In figures 7.1 and 7.2 the DER scores are shown for each one of the excerpts used in the evaluations for conference and lecture room data. The different excerpts are shown in the horizontal axis and the DER in the vertical axis, showing one curve for each one of the presented systems as described before. In the lecture room data the table omits the full meeting names and just show the terminations, which indicates the content of the meeting. Excerpts terminated with ``E1'' or ``E3'' only contain the lecturer and therefore it is easier for the system to obtain a perfect diarization.
The use of filter&sum to enhance the signal before doing the clustering turned out to be a bad choice for the conference room systems, as the SDM DER is smaller than the MDM. This was explained due to the big difference between the quality of the signal of the different microphones. When using the best quality microphone as the SDM channel it is difficult to improve such signal using the other channels combined via filter&sum. A weighted version of the algorithm was proposed to automatically (and adaptively) weight those channels with better quality signal. The weight computation was improved for RT06s evaluation.