Next: Reference Channel Estimation Analysis Up: Acoustic Beamforming Experiments Previous: Acoustic Beamforming Experiments Contents
| |||||||||||||||
Table 6.5 shows the SNR and DER results for the development and test sets. The SNR values are obtained in the same way as in section 3.2, doing a lineal average of the values from each meeting source. The first thing to observe is that although the SNR for the test set is much higher than the development set, the DER values are otherwise, which raises a warning on how uncorrelated these two metrics are. This phenomenon will be repeated throughout the experiments in this section.
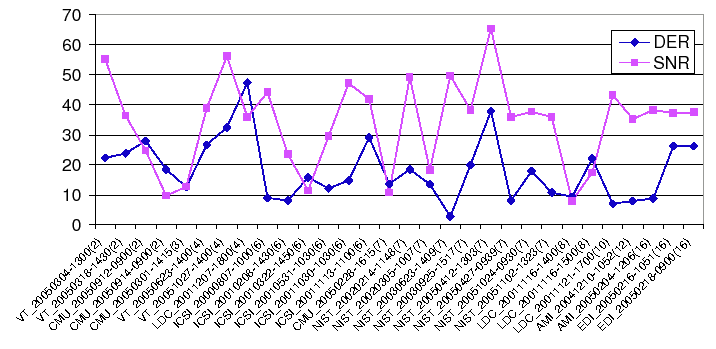
To further show the lack of correlation of the SNR vs. DER values, figure 6.3 shows the individual values for all shows (22 dev + 8 eval) used in the experiment in table 6.5. The meetings in the X axis are sorted according to the number of available microphones (shown in parenthesis). Both the DER and SNR values share the same Y axis, although SNR is better the higher it goes and DER otherwise. No correlation can be observed neither between SNR and DER values nor with SNR and the number of channels in the meetings.
As for the SNR values it totally depends on the particular rooms, time of day of the recordings and the type of microphones being used. Two cases where values are stable are the AMI project meetings (including AMI and EDI recordings) which keep a very constant SNR value around 37db in average. The DER results depend on these and many other factors. In Mirghafori and Wooters (2006) some of these factors are studied, referring to the high variability of the DER values as show flakiness.
Therefore, it becomes clear that SNR and DER do measure and are affected by different phenomena. A signal output with higher SNR (therefore higher signal quality) does not necessarily lead to a better DER. Given that the aim of this thesis is to improve the diarization output, the DER is the metric that will be most observed (and minimized) but the average SNR will still be shown for all cases as comparison. For other applications, like using the output signal for ASR, the SNR is still the metric to be maximized. Results for ASR using the presented filter&sum system are shown in section 6.4.5.
user 2008-12-08